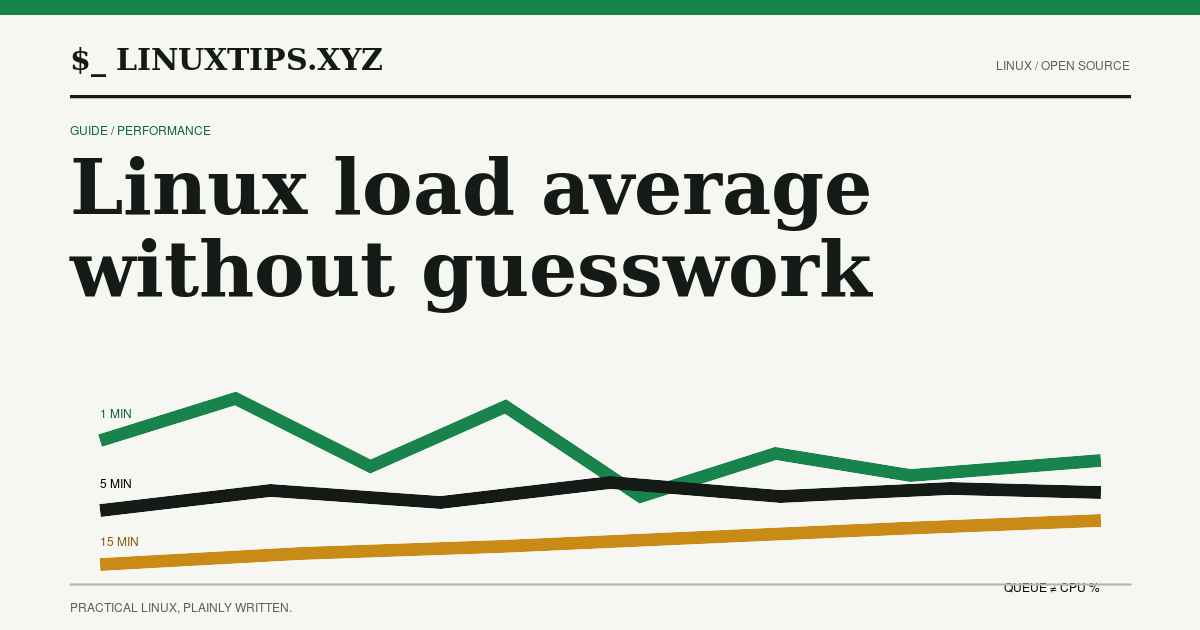
Load average is a queue signal, not a CPU percentage. On Linux, it tracks work that can run and work stuck in uninterruptible sleep. That distinction explains the classic surprise: a machine can report a high load while its CPUs are not fully busy.
The three numbers become useful only after you add context. How many CPUs can
the workload actually use? Is the short trend rising or falling? Are tasks
runnable, blocked, or both? Is CPU, memory, or I/O pressure stealing useful
time? This guide turns one familiar line from uptime into a bounded diagnostic
sequence.
What Linux puts in the average
/proc/loadavg exposes five fields. The first three are the load averages
usually labeled 1, 5, and 15 minutes. Linux counts jobs in runnable state R
and jobs in uninterruptible state D. The fourth field is runnable/total
kernel scheduling entities; the fifth is the most recently created PID.
0.74 1.06 0.94 3/871 3809387
│    │    │    │     └─ most recently created PID
│    │    │    └─────── runnable entities / total entities
│    │    └──────────── 15-minute load
│    └───────────────── 5-minute load
└────────────────────── 1-minute loadProcesses are not the only scheduling entities in that fourth field. Threads
count too. The exact live numerator can also change while the file is being
read, so do not expect it to match a later ps snapshot perfectly.
The three averages are smoothed trends rather than three instantaneous queue lengths. Think of them as short, medium, and longer memory: the 1-minute value reacts fastest, while the 15-minute value moves slowly. They are not three CPU utilization percentages.
Normalize carefully, then stop normalizing
CPU count is a useful first denominator. A load of 1 on a machine that can run one task at a time means something different from a load of 1 on a machine with 32 available CPUs.
getconf _NPROCESSORS_ONLNIf the command prints 6, a load near 6 suggests roughly one runnable or
uninterruptible task per online CPU on average. That is a triage heuristic—not
a health verdict. Reasons it can mislead include:
Dtasks add to load even while they are not consuming a CPU;- CPU affinity can restrict work to fewer CPUs than the system-wide count;
- a container may see host topology while a cgroup quota limits usable CPU;
- one latency-sensitive thread can suffer while the machine-wide ratio looks comfortable; and
- heterogeneous cores do not all provide identical capacity.
Normalize once to decide whether to investigate. Then inspect the workload and its pressure instead of polishing the ratio.
Read the three-number shape
The order of the values gives direction, but not cause.
| Shape | Plausible reading | What it does not prove |
|---|---|---|
| 1-minute above 5-minute above 15-minute | Demand or blocked work increased recently | CPU saturation |
| 1-minute below 5-minute below 15-minute | The earlier queue is draining | The incident is over |
| All three close together | A relatively steady queue | A healthy service |
| High load with low CPU use | Uninterruptible waits may contribute | Storage is definitely at fault |
The word may matters. State D is uninterruptible sleep, commonly observed
around I/O, but a load number cannot identify the device, subsystem, or task.
Inspect those separately.
A read-only triage sequence
Start with identity, capacity, and the raw source. These commands do not mutate the system.
uname -sr
printf 'online CPUs: '
getconf _NPROCESSORS_ONLN
printf 'loadavg: '
cat /proc/loadavg
uptimeNext, count current thread states. The snapshot will not reconstruct the historical average; it answers the narrower question “what is visible now?”
ps -eLo state= |
  awk '{ count[$1]++ } END { for (state in count) print state, count[state] }' |
sortThen list runnable and uninterruptible threads with their wait channel when the kernel and permissions expose it:
ps -eLo state,pid,tid,psr,comm,wchan:32 --sort=state |
awk 'NR == 1 || $1 == "D" || $1 == "R"'wchan is a clue, not a complete stack trace. It can be blank, masked, or too
generic. Use it to choose the next subsystem, not to declare root cause.
Finally, compare queue history with recent stall time:
for resource in cpu memory io; do
  printf '%s ' "$resource"
  head -n 1 "/proc/pressure/$resource"
donePressure Stall Information (PSI) reports the share of time during which tasks
could not make progress because a resource was contended. Its avg10, avg60,
and avg300 windows are percentages, unlike load average. CPU some pressure
means at least some runnable work waited for CPU time. Memory and I/O pressure
point toward different queues.
Verified lab: one quiet six-CPU host
The read-only sequence ran on 2026-08-12 on Ubuntu 24.04.4 LTS, Linux 6.8.0-100-generic, with procps-ng 4.0.4 and six online CPUs. No artificial load was generated because the host was shared.
| Observation | Bounded output | Meaning in this snapshot |
|---|---|---|
/proc/loadavg |
0.74 1.06 0.94 3/871 … |
Recent load stayed well below six; the 1-minute value was below the 5-minute value. |
uptime |
load average: 0.74, 1.06, 0.94 |
procps reported the same first three fields. |
ps -eLo state= |
R 1, S 355 |
The later snapshot saw one runnable and 355 interruptible-sleep threads; no D row appeared. |
CPU PSI some |
avg10=2.84 avg60=3.48 avg300=3.16 |
Some tasks experienced CPU waiting even though the normalized load looked modest. |
Memory PSI some |
avg10=0.00 avg60=0.00 avg300=0.00 |
No measurable recent memory stall in these windows. |
I/O PSI some |
avg10=0.00 avg60=0.03 avg300=0.00 |
Only a small 60-second I/O-stall signal was visible. |
This is deliberately unexciting evidence. It demonstrates why the signals belong together: a low load-to-CPU ratio did not mean literally zero waiting, and a process-state snapshot did not equal the historical load average.
When load is high, split the question
Use the signal that matches the symptom.
- Are runnable threads waiting for CPU? Check CPU PSI and CPU utilization
by interval.
vmstat 1 5provides a short sample; itsrcolumn and CPU columns help distinguish queueing from idle time. - Are threads stuck in
D? List them withps, inspectwchan, then use the relevant storage, network filesystem, device, or kernel tooling. Do not assume everyDtask means a failing local disk. - Is the service slow without high system-wide load? Check its own latency, cgroup PSI, CPU quota, affinity, locks, and request queues. A host average can hide a local bottleneck.
- Did the spike already pass? Compare monitoring history with current PSI
totals and application timing. A current
pssnapshot cannot recreate the tasks that contributed ten minutes ago.
This sequence keeps observation ahead of intervention. Restarting a service, changing priorities, dropping caches, or killing blocked work changes the evidence and can worsen an incident. Capture the state first.
Common reading errors
“Load 6 means 600% CPU.” No. Load is a smoothed count of runnable and uninterruptible jobs. CPU utilization measures time spent in CPU states.
“Divide by CPU count and the answer is done.” The ratio is a useful alarm
scale. It cannot tell runnable work from D waits, express cgroup constraints,
or measure application latency.
“The 1-minute value is the average of 60 one-second samples.” Treat the labels as time constants for smoothed history, not rectangular buckets whose oldest sample falls off at a hard boundary.
“A falling 1-minute value means users recovered.” It only says the load trend fell. Confirm latency, throughput, errors, and resource pressure.
Portability boundary
The /proc/loadavg fields, Linux task states, and /proc/pressure/* interface
in this guide are Linux-specific. Other Unix-like systems expose load averages,
but their accounting rules and inspection tools can differ. PSI also depends on
kernel support; if /proc/pressure is absent, record that boundary and use the
available scheduler, CPU, I/O, and application metrics instead.
The durable model is small: load average tells you how much runnable or uninterruptible work accumulated over time. CPU count gives a first scale. Task states separate the queues visible now. PSI tells you where progress was lost. None of those signals replaces the others.
Continue the signal